A journalist producing an investigative story on financial corruption. A city bureaucrat communicating the impacts of urban sprawl. A grad student tracing the roots of rhythm and blues. Even a scientist explaining community spread of a deadly virus.
Today, data visualization has become an essential skill for communicating the complex – a skill about more than creating “pretty pictures” with data and instead about speaking clearly to the modern mind. Or as Kevin Hartman, chief analytics evangelist at Google, explained:
As humans, we are programmed to see patterns, to pull meaning from cluttered amounts of information. What data visualization does is lift out those stories, those patterns and communicates them visually. It is the perfect way to communicate to other humans.
While visualization does just that – makes data easy to digest by ensuring it tells a story – it is simultaneously structuring that data in a way that makes it possible to activate the insights being communicated. For businesses, that means data visualization provides an opportunity to not only process and understand its possibilities but also apply them in a meaningful way.
Visualization is about more than seeing – it is also about acting.
Want more INCITE?
Sign up and receive 3 print issues per year.
Sign upRooted in a visual history
You could start with cave drawings, if you wish. Or perhaps flash forward a few millennia to Flemish astronomer Michael Florent van Langren’s line graph charting the difference in longitude between Toledo and Rome. Or you could look at Scottish political economist William Playfair’s graph showing changes in wheat prices over 250 years. No matter where you drop your finger on the human timeline, visualization of some sort has been an elemental part of the way we communicate.
Why does visualization work? Well, it’s just a matter of how the brain processes information. Data visualization is effective because it shifts the balance between perception and cognition to take better advantage of the brain’s abilities.
Seeing (visual perception) is handled by the visual cortex located in the rear of the brain; this process is extremely fast and efficient. Thinking (cognition), on the other hand, is handled predominantly by the cerebral cortex in the front of the brain; this process is much slower and less efficient. That means traditional data presentation methods (think about those unforgiving spreadsheets) require conscious thinking to do all of the work. Data visualization, however, shifts the balance toward visual perception, to take advantage of the speed of seeing.
The better designed and more thoughtfully structured the data visualization, the more understandable, dimensional and useful it becomes and the faster it can be read and registered. That means you can move data into action far faster.

Putting the data visualization story into action
How does the best visualization work? Simply stated, the best data visualization tools don’t require a data scientist to read them – the eyes shouldn’t lie when it comes to data visualization.
The uninitiated tend to write off visualization as nothing more than pretty pictures for those who cannot wrestle with the complexities of a spreadsheet. Yes, graphic aesthetics are key to data visualization – that’s something a spreadsheet can never have. But visualization must also be so much more – novel, informative and efficient.
Data visualization and mapping tools structure data in ways that offer new layers of insight, relevance and perspective. One important area of application is in media and audience targeting – integrating data and looking at different audience dimensions to hone targeting criteria and strategies most valuable to your campaign goals.
You might also like:
- Build your brand by bringing new methods, systems and products to the marketplace
- Mow down the competition thanks to inspiration from this case study
The best of these tools offer an ease of use, can integrate large sets of data from different sources within a single visualization and can create a compelling and informative output. These tools should tear down the data silos that block actual insights and instead bring first-, second- and third-party data together in a coherent way.
Key struggles for marketers
Both the art and the science of visualization help marketers address some important struggles when it comes to advertising effectiveness:
Audience targeting
Understanding, identifying and reaching target audiences remain chief among challenges. Right now, Canadian marketers think they can accomplish this through digital and social platforms, but these are proving to be messy, with unclear, inconsistent or even disappointing results in the quality of connections digital channels make on their own.
Data integration
Cross-channel data integration is vital today as addressable audience strategies diversify in the wake of data privacy and new ad tech solutions that the industry is working on. The need to unify first-, second- and third-party data across channels has become harder, yet increasingly critical.
Data transparency
Data silos within our organizations and walled-garden media investments have made it nearly impossible to connect the dots. Data transparency and integration remain challenges of communication as much as technology.
Data mapping, however, can overcome these challenges.
Applying the right data visualization tools
There are a host of visualization tools on the market, with everyone from niche apps to mega-corporations offering their own solutions. Picking the correct one, however, is a matter of understanding your goals, gaps and job you need help preforming.
For marketers, that answer is simple – your visualization tool should provide a competitive advantage across all media.
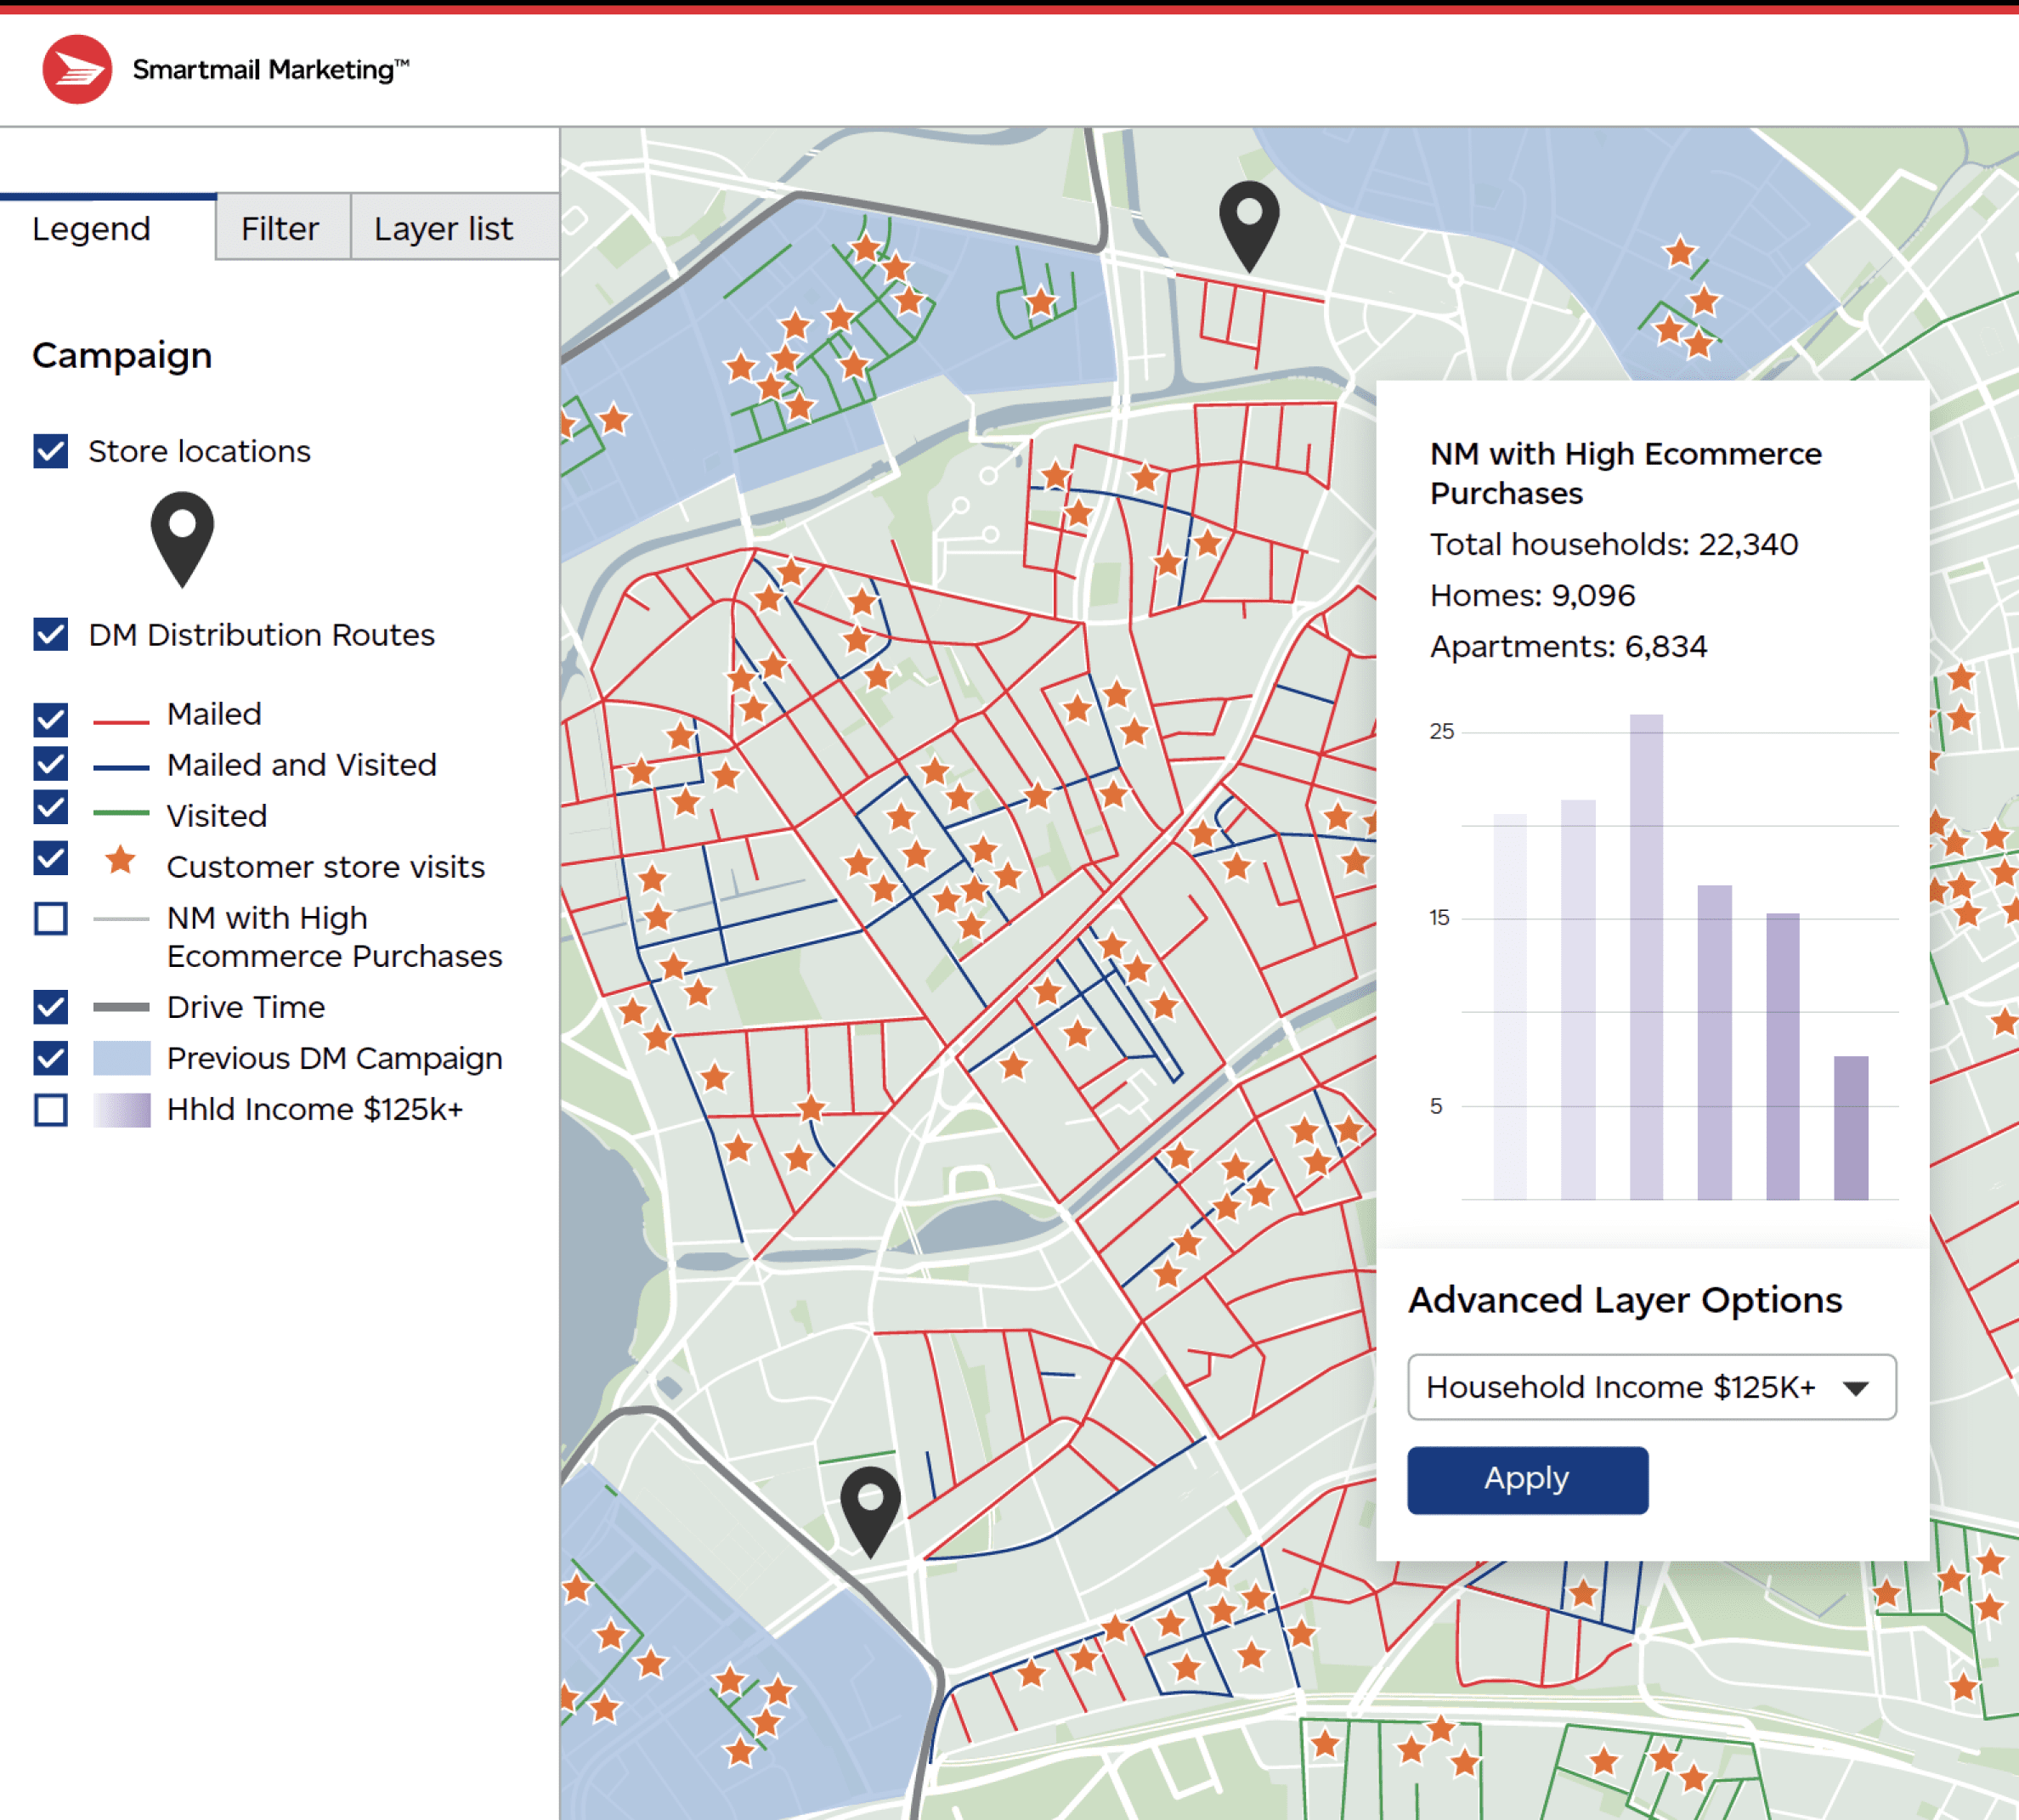
Let’s take Canada Post’s data visualization tool as an example. This tool, supported by a data analytics team, maps out data so decision makers can visually explore audience targeting opportunities and strategies. It can overlay different data sets – customer data, store locations, competitor data, mobile foot traffic data, demographics and other Canada Post proprietary data. It can produce multiple data overlays to make data more tangible, connecting the dots in new ways so that you can create a multidimensional picture of targeting opportunity.
This data can be uploaded to digital ad platforms like Facebook to improve digital targeting or be used to manage cross-channel and direct mail programmatic targeting. You can even map direct mail response data for post-analysis and optimization (test, learn, adapt).
This versatility provides solutions to multiple problems:
- An organization without reliable first-party data can lean into mobile geolocation tracking data around their store locations to let foot traffic guide their mailings to look-alike postal codes.
- An ecommerce business without a physical location can combine its first-party data with mobile data around competitor locations or postal code data showing high propensity for online category shopping in order to acquire new customers.
- A business that doesn’t understand who its potential customers are can overlay existing customer data, previous mailing locations, competitor data, mobile foot traffic data and psychographic clusters to see pockets of opportunity to grow a customer base.
Across these sample use cases, the same general solution is applied: putting data to work in a clear and accessible way that can be applied across channels and to direct mail specifically.
Amplifying the value of direct mail media
While we’re not suggesting direct mail is the only solution, the evidence tells us that direct mail, postal code data and the home can bring new insight and increased effectiveness to audience addressability and the customer journey – filling in reach gaps, reducing targeting waste and improving message relevance and cross-media conversion, according to the latest WARC whitepaper, Driving Effectiveness with Direct Mail.
Advertisers are finding it necessary to re-evaluate how to identify, target and engage audiences in a privacy-compliant, brand-safe way that does not compromise experience or advertising effectiveness.
By thinking more about what you need from data to reach, relate to and activate your desired audience, the performance of each channel will become more effective.
When considering what identity data you need for targeting, don’t overlook the potential in people’s homes. Even as the world emerges from the pandemic and many workplaces and classrooms begin to fill again, the role of the home has forever changed and will remain a key stop in the customer journey and the main location for consumer decision making and influence as brands increasingly lean into direct-to-consumer strategies.
Data visualization helps businesses and organizations connect with people in the home environment through a media format that can speak to them about what they are interested in and care about at the individual level.
As ad tech fails and data persistence erodes, data mapping and visualization tools can fill the need for data insight that reinforces your strategies and tactics toward your goals as an organization.
Expertise you can count on
You won’t believe what we see when it comes to opportunities for your brand.
Let’s chat